Woody Hayes was supposed to have run up the score 42-12 late in the third quarter and went for a two-point conversion, shortly before the clock ran out. Asked why, he was said to have answered
There are no 3-point conversions!
In the same spirit, I posted the other day about a tweet
“There is no bubble”
— Daniel Lacalle (@dlacalle_IA) December 30, 2019
via DB pic.twitter.com/MnMSpE38q2
propagating a plot was attributed to Deutche Bank Research purporting to show a linear regression of the weekly change in Federal Reserve Bank assets against the weekly change in the S&P Index.
I ran the model with data from Fred for the paltry number of weeks in 2019Q4.
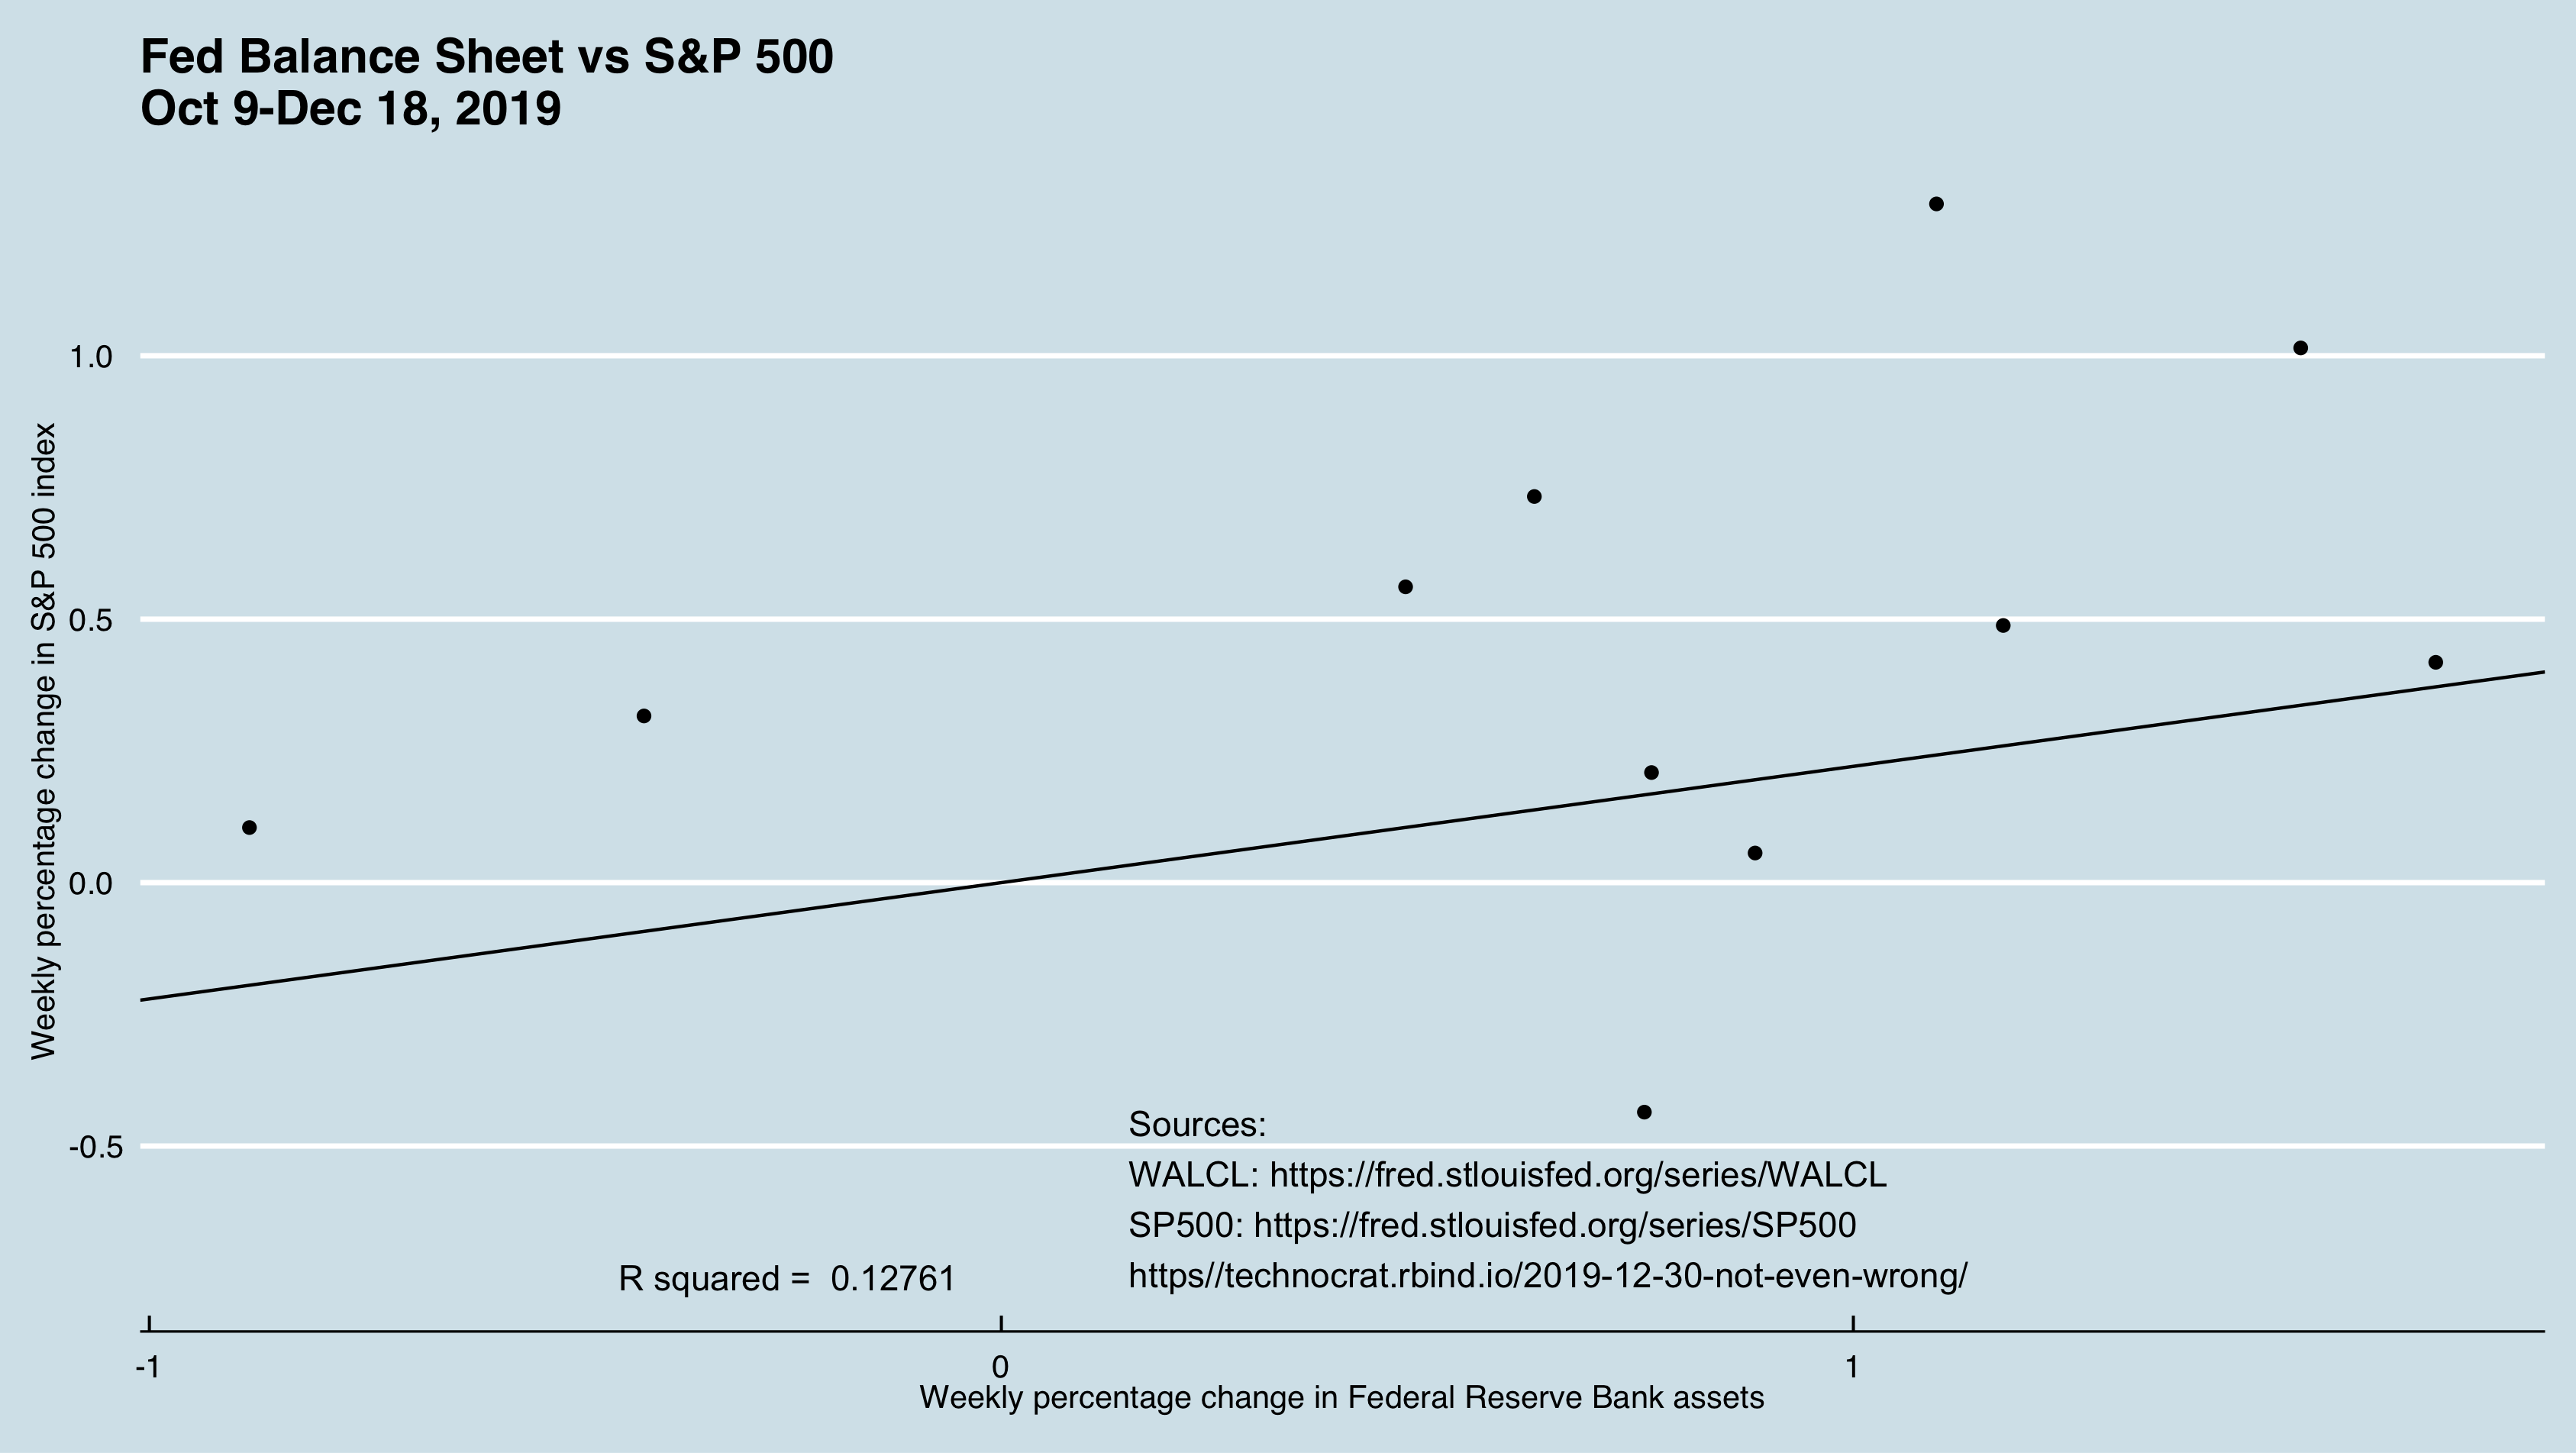
For snicks, I’m now taking a look at \(n = 52\), the entire year.
suppressPackageStartupMessages(library(broom))
suppressPackageStartupMessages(library(dplyr))
suppressPackageStartupMessages(library(ggplot2))
suppressPackageStartupMessages(library(ggthemes))
suppressPackageStartupMessages(library(readr))

fed <- read_csv("https://gist.githubusercontent.com/technocrat/742747b30ea4c0270f5dbdda0db95a36/raw/47b49a188273af3aed2068017d30b7522500fd23/walcl_2019_PCH.csv")
## Parsed with column specification:
## cols(
## DATE = col_date(format = ""),
## WALCL_PCH = col_double()
## )sp <- read_csv("https://gist.githubusercontent.com/technocrat/d3dc120528026a634c7a9cbd223ff003/raw/c5127108739298743ad6ee16ce937c49ab321b22/sp500_2019_PHC.csv")## Parsed with column specification:
## cols(
## DATE = col_date(format = ""),
## SP500_PCH = col_double()
## )fed_v_sp <- inner_join(sp, fed, by = "DATE")
fit <- lm(formula = WALCL_PCH ~ SP500_PCH, data = fed_v_sp)
slope <- fit$coefficients[2]
r2 <- summary(fit)$r.squared
rsq <- paste("R squared = ",round(r2,5))
sources <- "Sources:
WALCL: https://fred.stlouisfed.org/series/WALCL
SP500: https://fred.stlouisfed.org/series/SP500
https//technocrat.rbind.io/2019-12-30-not-even-wrong/"
heading <- "Fed Balance Sheet vs S&P 500\nJan 2 2018-Dec 18, 2019"
y_lab <- "Weekly percentage change in S&P 500 index"
x_lab <- "Weekly percentage change in Federal Reserve Bank assets"
p <- ggplot(fed_v_sp, aes(SP500_PCH, WALCL_PCH))
my_model_plot <- p + geom_point() + geom_abline(slope = slope) + annotate("text", x = 0.15, y = -0.6, label = sources, hjust = 0) + annotate("text", x = -0.25, y = -0.75, label = rsq) + labs(x = x_lab, y = y_lab) + theme_economist() + ggtitle(heading)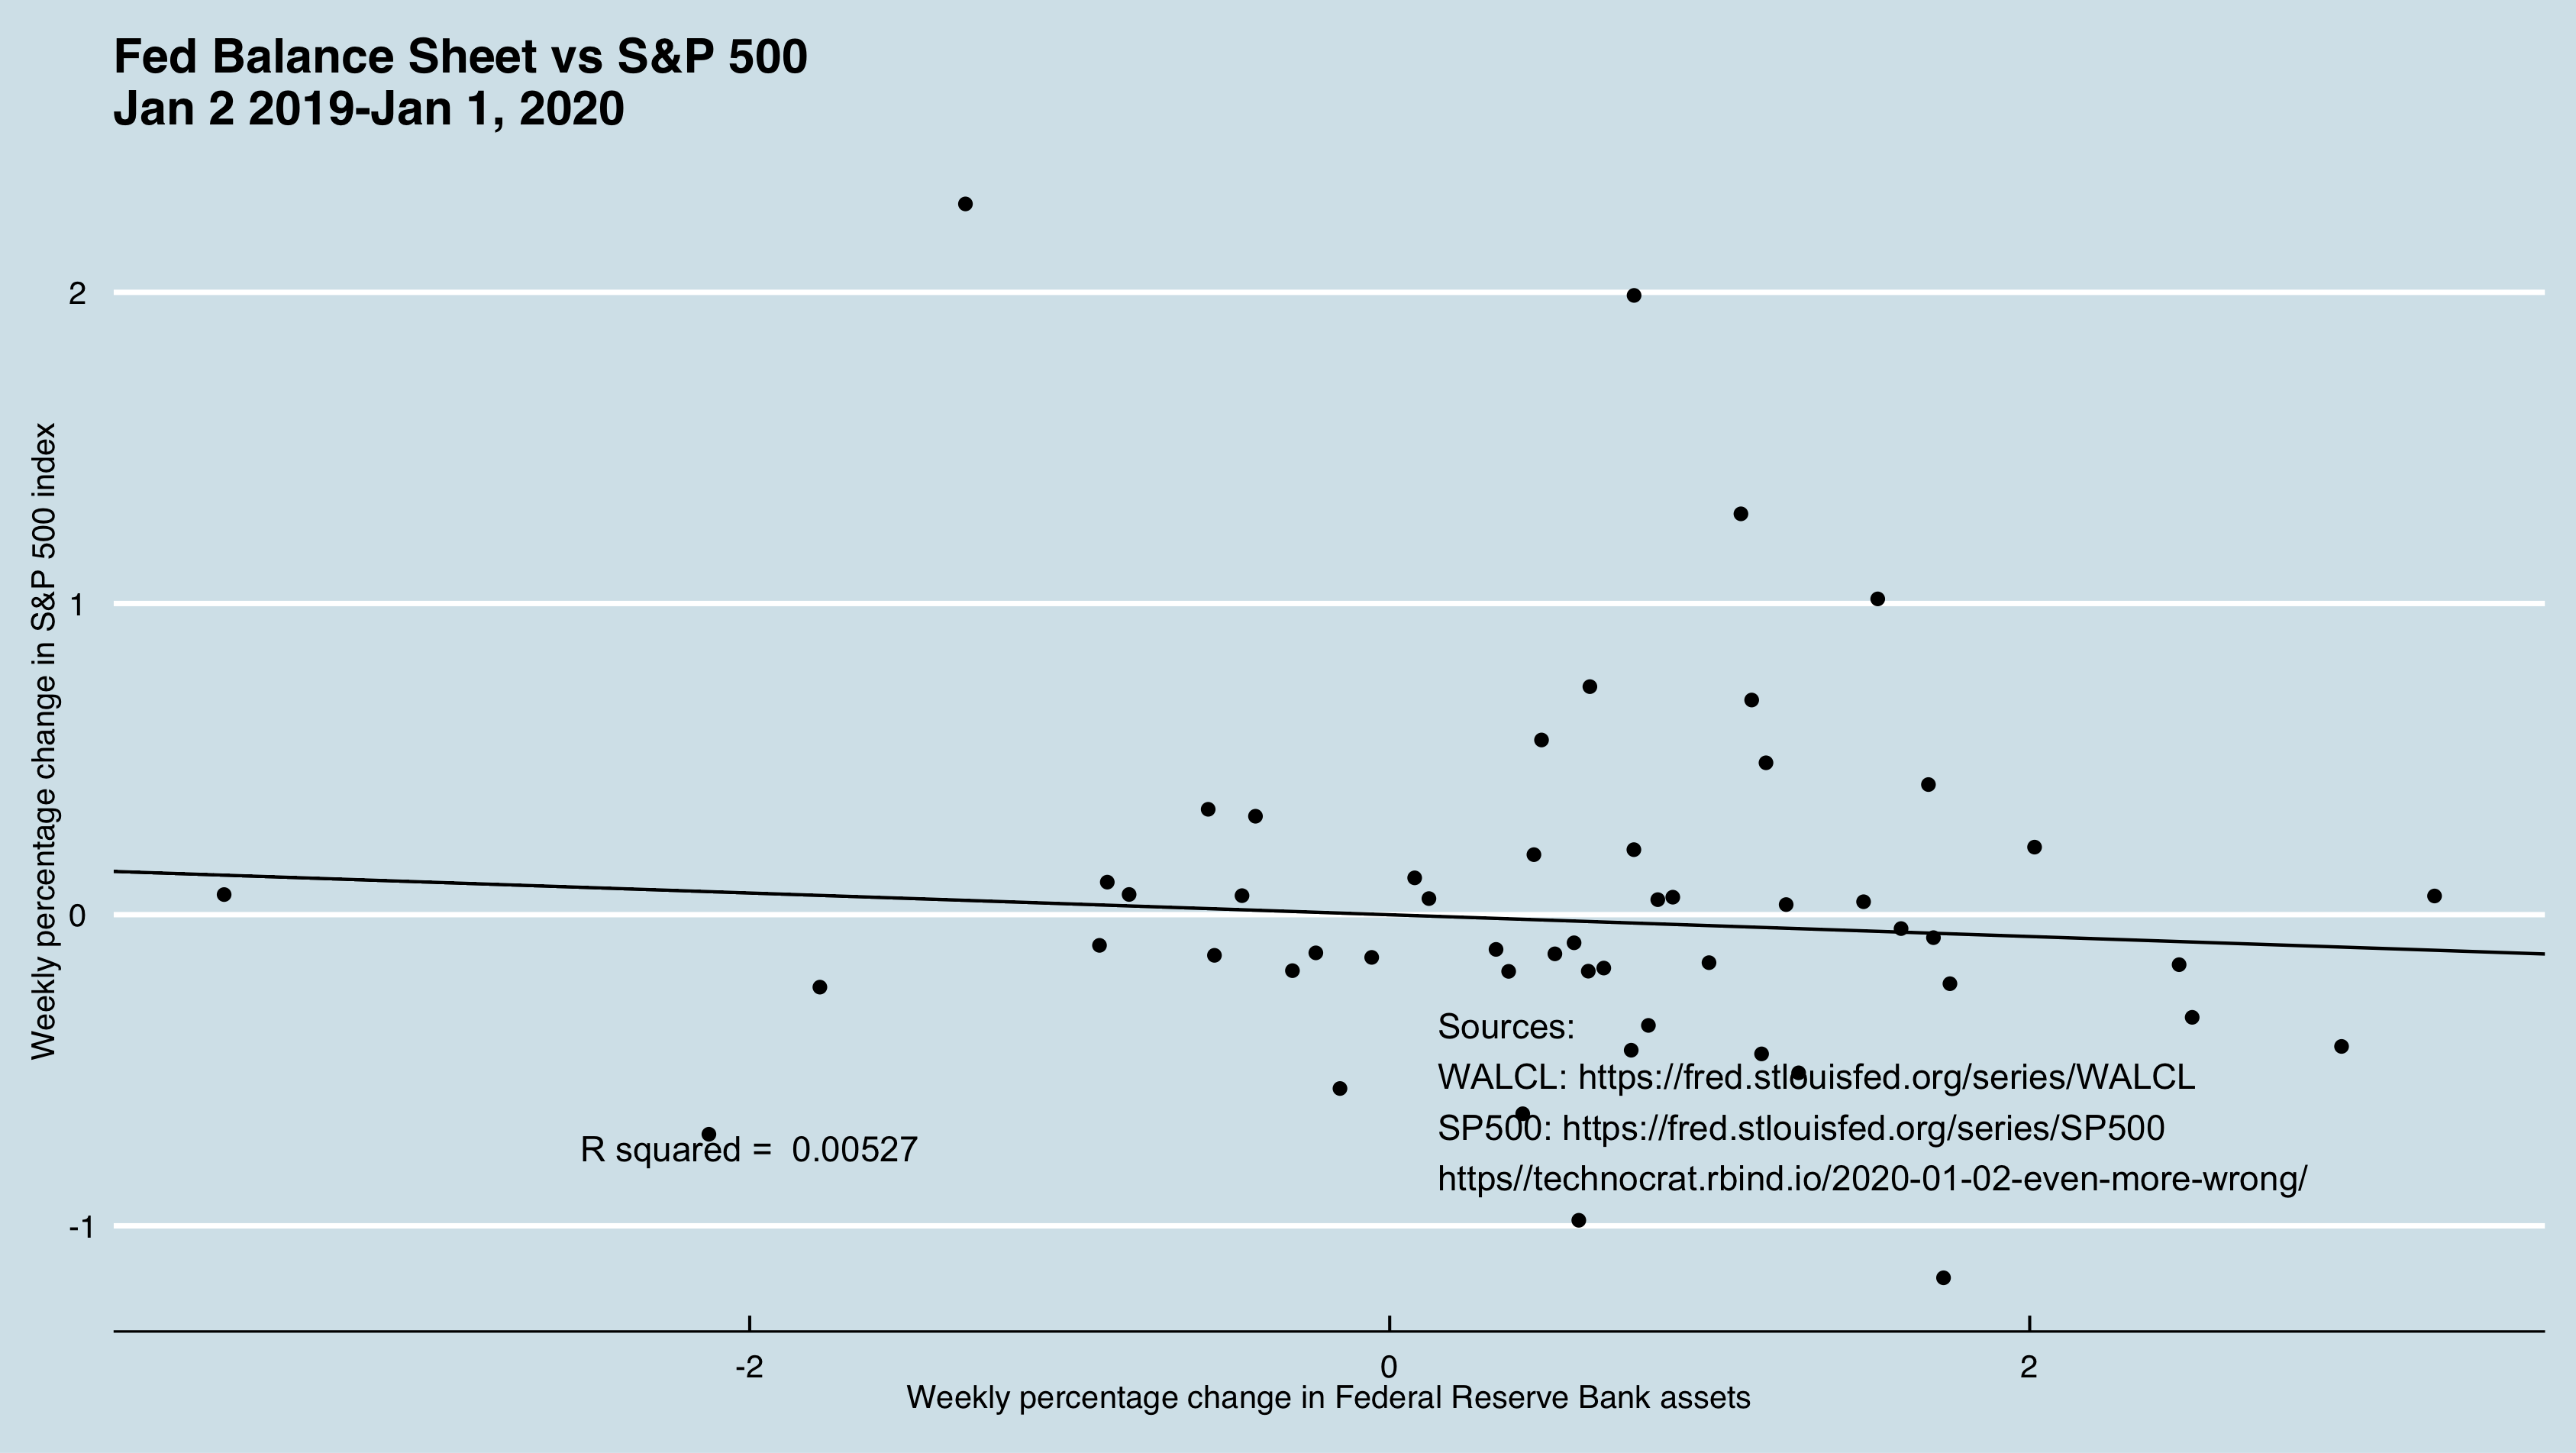
If Deutche Bank Research’s mission statement
Deutsche Bank Research is responsible for economic analysis within Deutsche Bank Group and covers asset allocation and all major industry sectors. We analyse relevant trends for the bank in financial markets, the economy and society, highlight risks and opportunities and act as consultant for the bank, its clients and stakeholders.
Deutsche Bank Research delivers high-quality, independent analysis and actively promotes public debate on economic, fiscal, labour market and social policy issues.
is a an accurate reflection of the plot in the original tweet, then obviously its attribution was in error. On the other hand … . Alternatives are left as an exercise for the reader.