The Federal Bureau of Investigation (FBI) has lead responsibilities for protecting the United States against domestic crimes initiated abroad. These responsibilities include protection against “covert actions by foreign governments to influence U.S. political sentiment or public discourse” (https://www.fbi.gov/investigate/counterintelligence/foreign-influence). It has illustrated its mission description with a world map that appears to classify nations by the threats they pose.
The map has no description or legend, but uses several shades of blue to distinguish among countries.
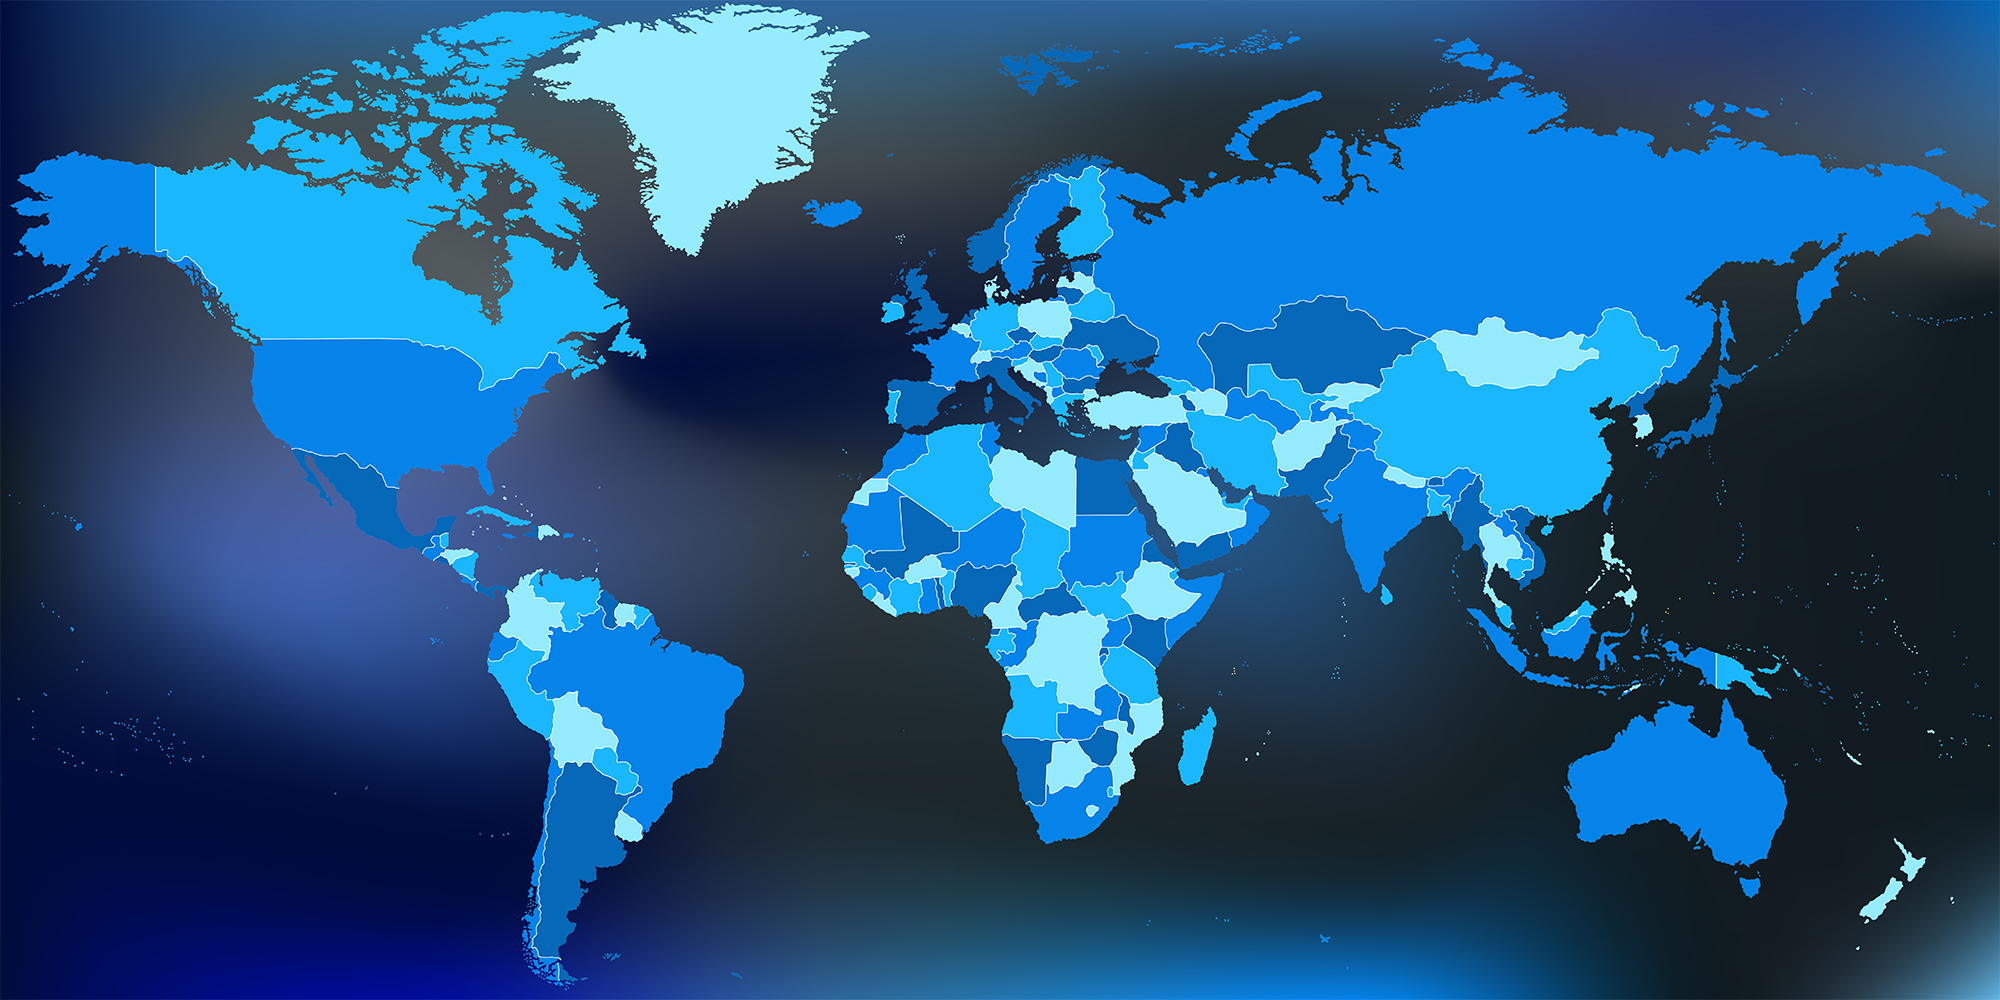
A reasonable interpretation is that the color coding goes from light, representing the least threat, to dark blue, representing the greatest threat, if indeed this is a threat assessment. After all, how big a threat could lightest blue colored Greenland possibly pose?
Canada is somewhat darker, but is exactly the shade of, surprise, China. (You can easily measure websafe color values). That seems somewhat strange. But not as strange as the identical darker blue colors shared by Russia (no surprise) and the United States. It’s possible, I suppose, that these two countries share the same attributes on something. Molybidium reserves? But definitionally, how can the U.S. pose a foreign influence effect on itself?
Besides, although few people suffer from blue-light color blindness, it can be difficult to make fine distinctions among shades of blue.
Here is a filtered version of the original that addresses but does not represent a good approach to the problem, for which I’d need the underlying data.

In this color scheme, the good guys are green, the mild threats are a very low intensity purple, and the bad actors are in increasingly dark shades of purple. Ugly, I know, but easy to explain and interpret. The oceanic colors are a by-product of unnecessary decorative flourishes in the original.
A data scientist who simply says “here are the numbers on a colored map” is not doing her job. Color communicates, and it had better do a good job of conveying an accurate understanding of the data it represents. Fortunately, there is a rich suite of tools, such as ColorBrewer (http://colorbrewer2.org/#type=sequential&scheme=BuGn&n=3) to help the vast majority of data scientists who aren’t trained as graphic designers.